Data & decision support
Workforce Modelling Dashboard
A bespoke decision-support tool for a large UK policing organisation — reconciling the workforce they'd designed with the people actually in post, and keeping that picture live as both change.
- Problem
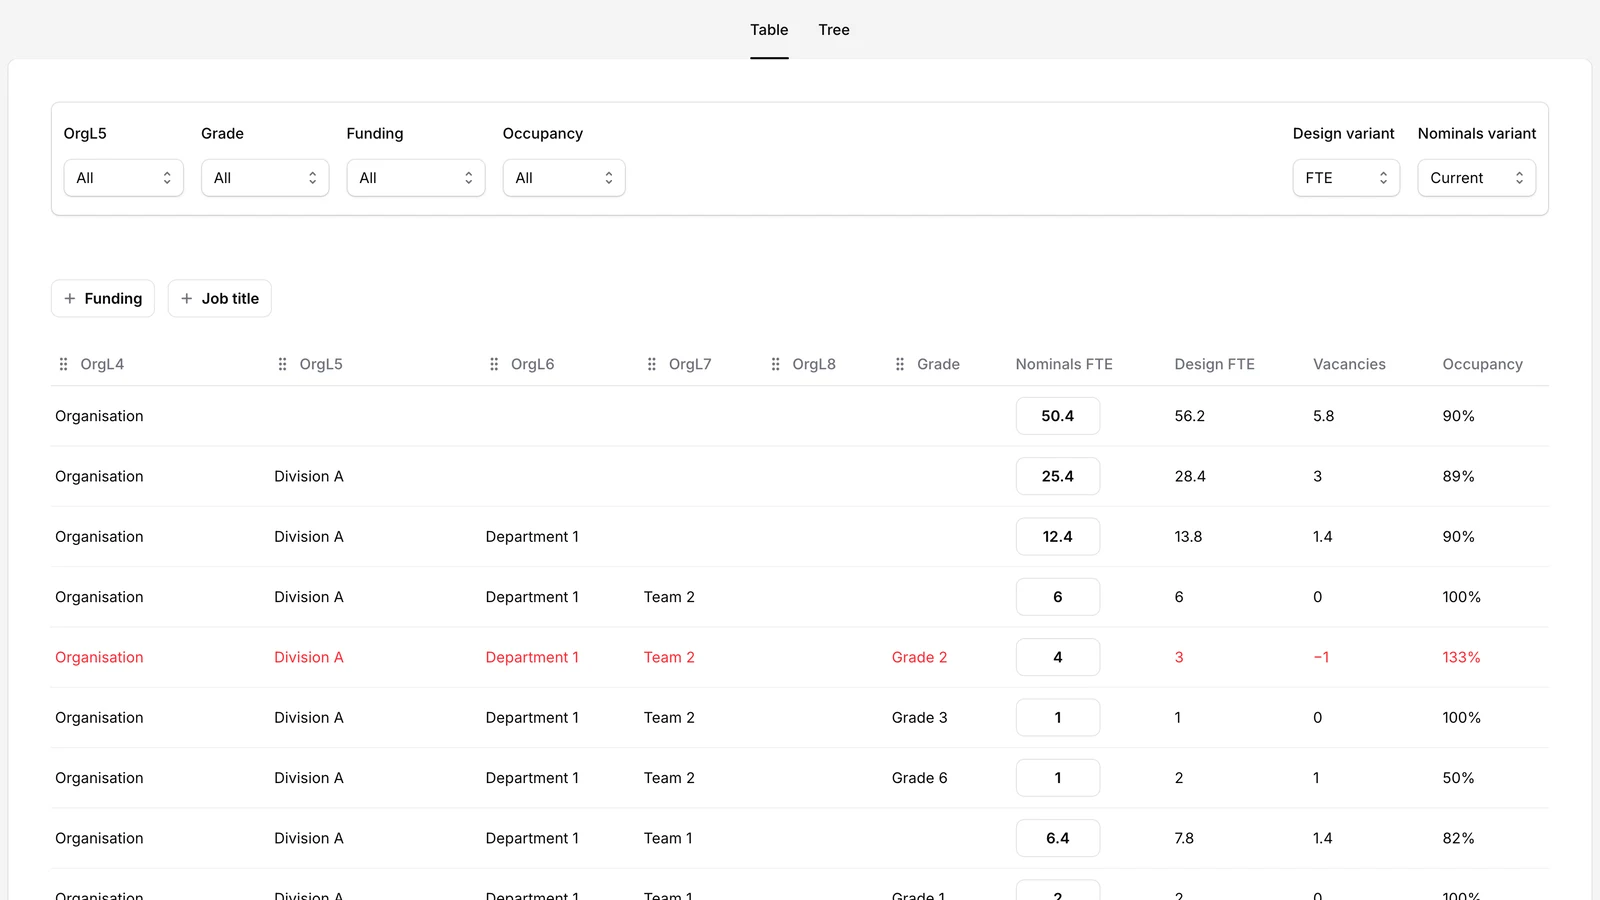
- Planning spanned two moving targets — the establishment they'd designed, and the people actually filling it. Held in separate spreadsheets, the two were near-impossible to reconcile, so vacancies, over-staffing and funding gaps stayed hidden until they bit.
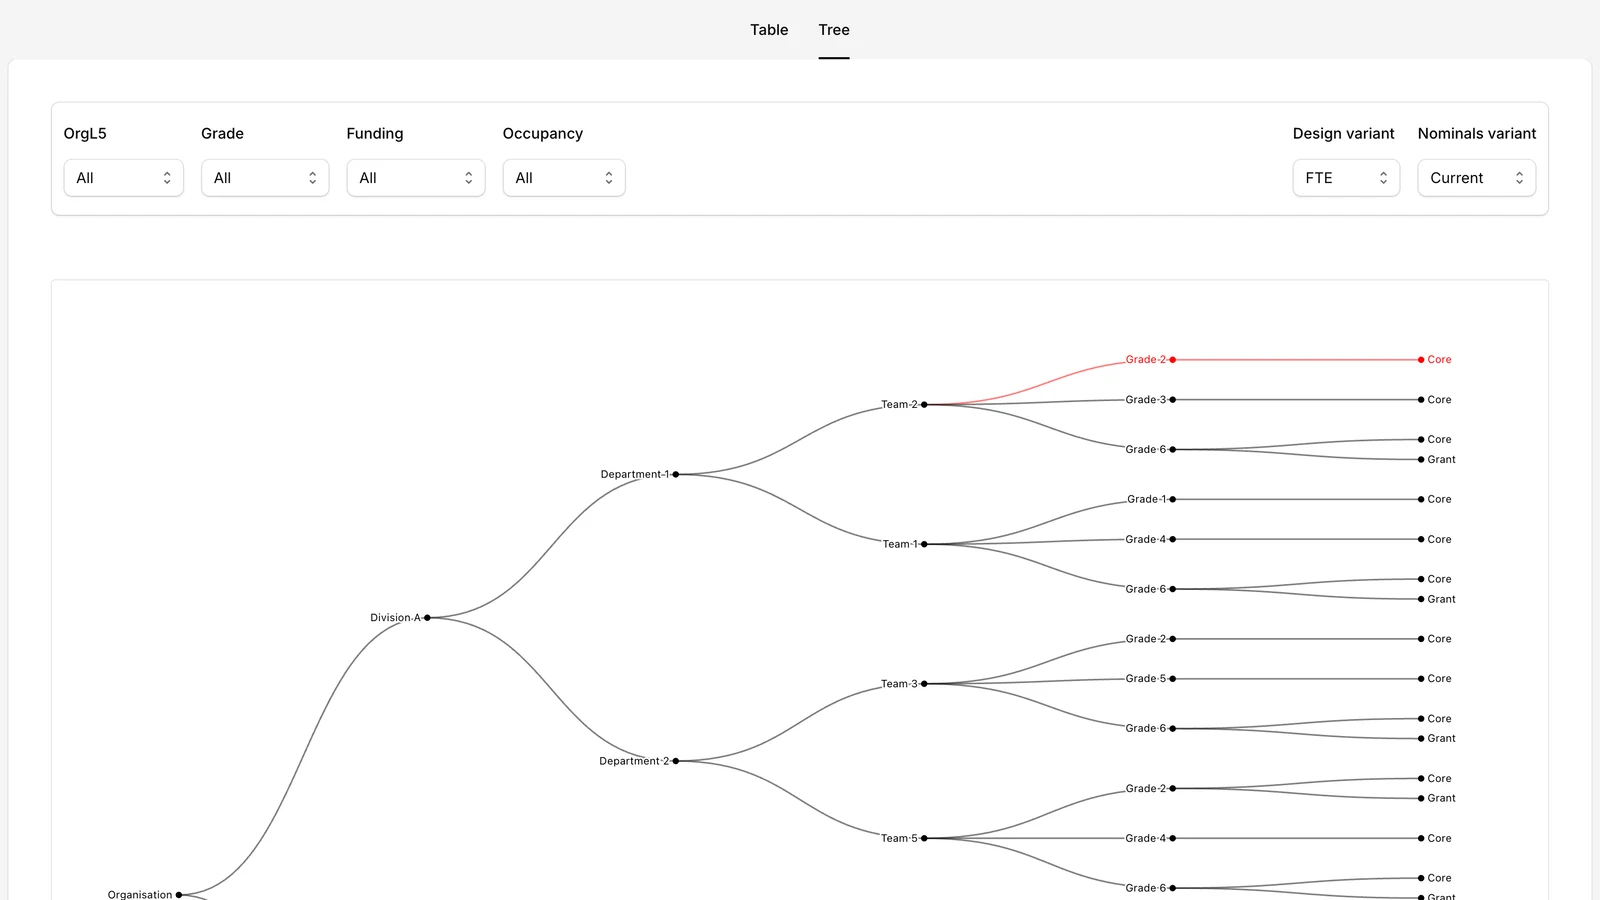
- Approach
- Rather than a generic dashboard, I designed the tool around the actual problem: continuously match designed posts to real post-holders, then surface the gaps. Two live feeds reconcile on every load, a pivot view slices by command, rank and funding, and an Expression-of-Interest mode models proposed moves against the live picture before anything is committed.
- Outcome
- Gaps that were previously invisible are now obvious at a glance — and stay current automatically. Planners model change safely before acting, and the organogram is never out of date because it's computed from live data every time it's opened.
Client work shown anonymised. All names, structures and figures above are illustrative and fully synthetic — no real data is shown.
For a public sector organisation mapping over 1,500 people — with tens of moves and design changes every single day — this was genuinely game-changing. What was previously impossible to keep on top of, everyone can now access and self-serve: people check their own data and answer their own queries. It's saved us hours and hours.